EUR/USD 5-Minute Analysis
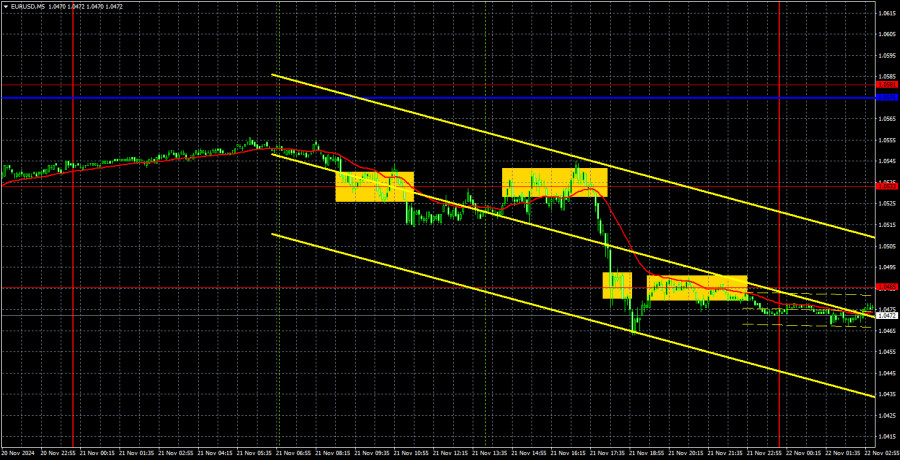
On Thursday, the EUR/USD pair continued its downward trend. Over the past few days, the price has been moving sideways in a flat, range-bound channel. However, yesterday, we mentioned that the price had started to decline within this flat, which could mark the beginning of another leg down for the euro. During the day, the price broke below the 1.0485 level, effectively breaching the lower boundary of the horizontal channel. As anticipated, the euro remains highly overbought and unjustifiably expensive. Thus, its decline was expected.
Previously, we indicated that the minimum target for the pair's decline is around 1.0450. However, in reality, the euro could fall much further. Parity with the dollar is a realistic target over the coming months. Remarkably, the euro's rapid descent from 1.1200 to 1.0500 exceeded expectations. Yet, as we repeatedly mentioned in 2024, the euro's rally was baseless, and the market had to realign the dollar's exchange rate. This correction is happening now without any specific macroeconomic or fundamental triggers.
As evidenced yesterday, the euro had no reason to rise, especially as it hit its lowest levels in six months or more. Nevertheless, the market continued selling the euro and buying the dollar. Thursday produced multiple trading signals. Initially, the price broke through the 1.0533 level and rebounded, presenting traders with short-selling opportunities. Later, the price broke below the 1.0485 level, paving the way for further declines today.
COT Report
The latest COT report, dated November 12, shows that the net position of non-commercial traders has remained bullish for a long time. The last attempt by bears to gain dominance failed. However, a month ago, professional traders significantly increased their short positions, leading to the net position turning negative for the first time in a long period. This indicates that the euro is now being sold more frequently than bought.
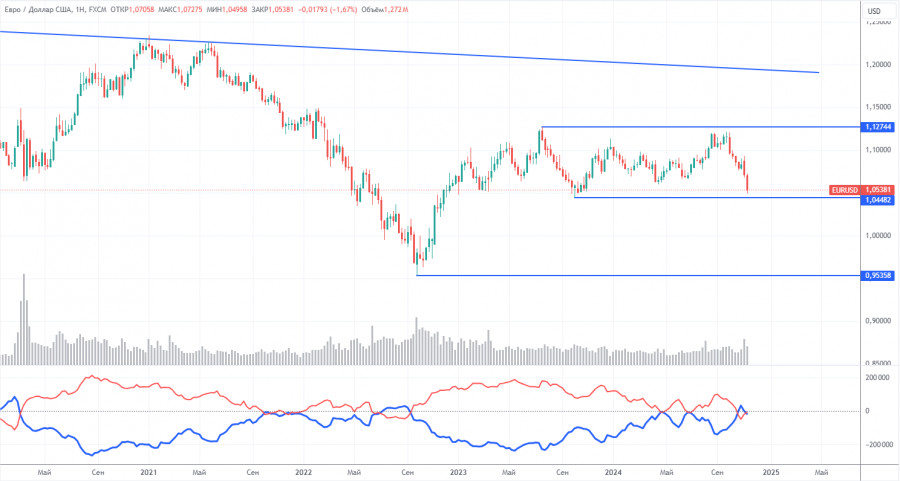
We still see no fundamental reasons for strengthening the euro, and technical analysis suggests the price remains in a consolidation zone�essentially a flat trend. On the weekly timeframe, it's clear that since December 2022, the pair has traded between 1.0448 and 1.1274. The market has transitioned from a seven-month flat phase to a 22-month phase. Thus, further decline remains likely toward 1.0448, which is only a short distance away.
Over the last reporting week, the number of long positions among the non-commercial group increased by 100, while short positions decreased by 14,100, causing the net position to grow by 14,200. The euro's downside potential remains significant.
EUR/USD 1-Hour Analysis
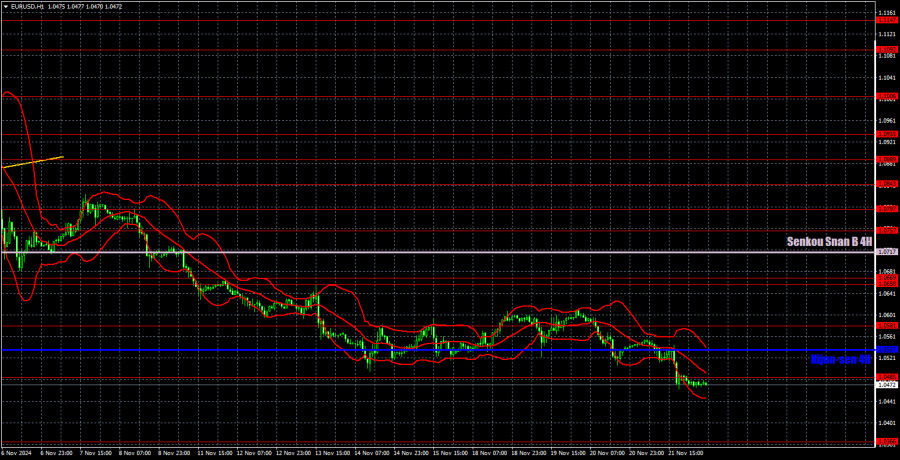
On the hourly chart, the pair continues to develop its downtrend. There's no need to elaborate on the macroeconomic or fundamental drivers for the dollar's medium-term decline�they don't exist. We anticipate only further declines in the euro in the medium term. Each passing day reinforces the belief that the market has fully priced in the Federal Reserve's policy easing cycle, with no rush to cut rates further. The euro has little room for even minor upward corrections.
For November 22, we highlight the following levels for trading: 1.0340-1.0366, 1.0485, 1.0581, 1.0658-1.0669, 1.0757, 1.0797, 1.0843, 1.0889, 1.0935, 1.1006, as well as the Senkou Span B (1.0717) and Kijun-sen (1.0537) lines. Remember that the Ichimoku indicator lines may shift throughout the day, so monitor them closely when interpreting trading signals. Also, set a Stop Loss order to break even if the price moves 15 pips in your favor to minimize potential losses in case of false signals.
November PMI data from the eurozone, Germany, and the US will be released on Friday. While these are not the most critical reports, they could provoke some market reactions. The University of Michigan's Consumer Sentiment report, also of medium importance, will be published in the US.
Chart Explanations:
Support and resistance levels: thick red lines around which movement may end. They are not sources of trading signals.
Kijun-sen and Senkou Span B lines: Ichimoku indicator lines transferred from the 4-hour to the 1-hour timeframe. These are strong lines.
Extreme levels: thin red lines where the price previously rebounded. They are sources of trading signals.
Yellow lines: Trend lines, trend channels, and other technical patterns.
Indicator 1 on COT charts: The net position size for each category of traders.


