empty
20.03.2025 07:19 PM
EUR/USD: Trading Plan for the U.S. Session on March 20th (Analysis of Morning Trades)

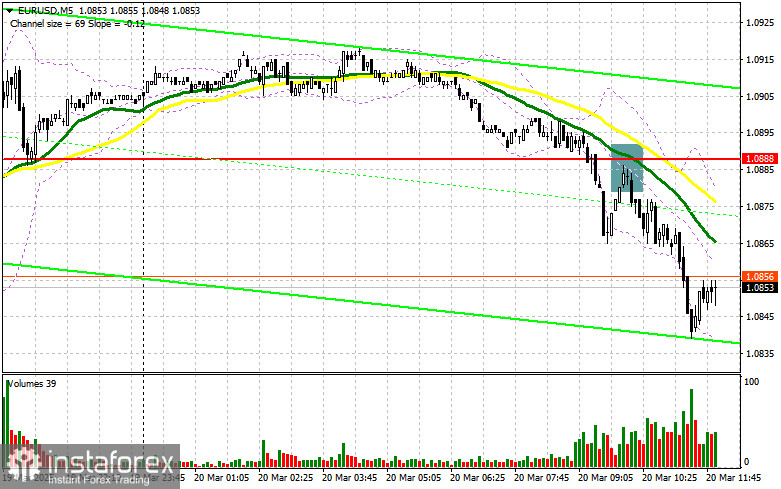
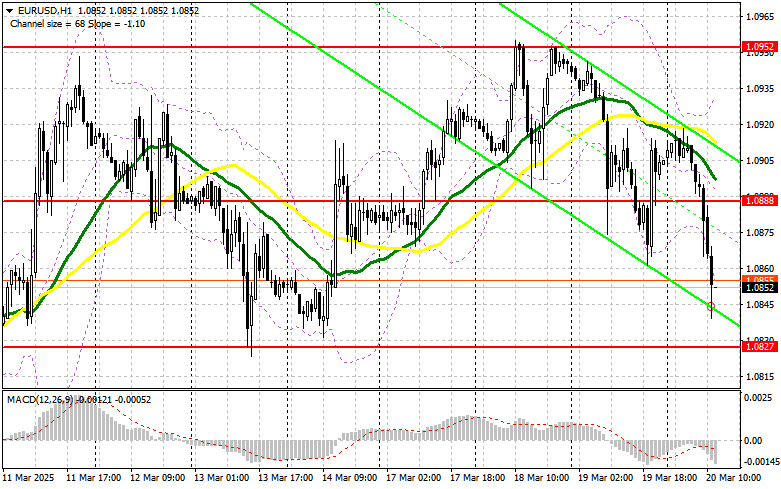
In my morning forecast, I focused on the 1.0888 level and planned to use it as a decision point for entering the market. Let's look at the 5-minute chart and analyze what happened. A breakout and subsequent retest of 1.0888 provided a strong entry point for selling the euro in line with the downward trend, leading to a drop of more than 40 points. The technical outlook has been revised for the second half of the day.

This image is no longer relevant

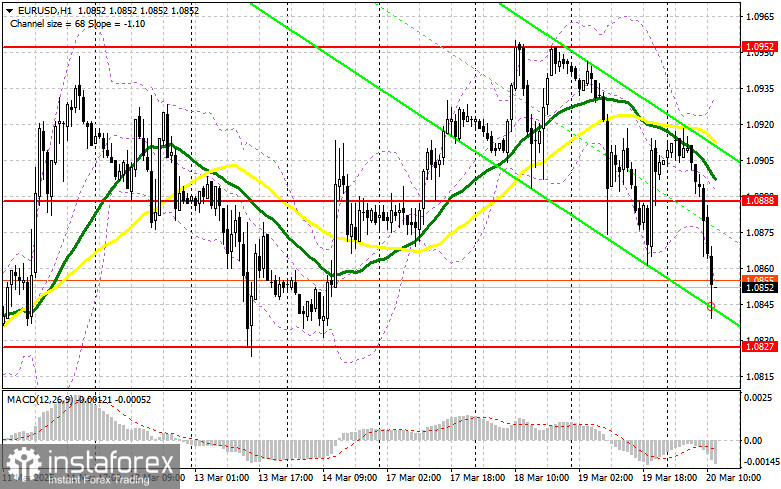
To open long positions on EUR/USD, yesterday's discussions about the Fed being forced to continue cutting interest rates in the U.S. did not help the euro continue its rise. Meanwhile, many market participants have shifted their attention to the European Central Bank and its potential rate cuts, which seem more likely given the latest inflation figures for the eurozone. In the second half of the day, we expect U.S. data on initial jobless claims, the Philadelphia Fed manufacturing index, and the current account balance. Strong U.S. data would strengthen the dollar against the euro. If the pair corrects further, only a false breakout around the 1.0827 support level would justify new EUR/USD buy positions, aiming for a bullish continuation toward 1.0888. A breakout and retest of this range would confirm a correct buy entry, targeting 1.0952 (the monthly high). The ultimate target would be 1.0997, where I plan to take profit. If EUR/USD declines and lacks buying interest at 1.0827—which is more likely—the pair will continue to correct downward. In this case, sellers will aim for 1.0770, and only after a false breakout at this level will I consider buying the euro. I plan to open long positions on a direct rebound from 1.0743, aiming for a 30–35 point intraday correction.

To open short positions on EUR/USD, sellers successfully broke the key 1.0888 support level, which has now turned into resistance. I recommend focusing on this level. If the pair reacts negatively to the data and EUR/USD rises, a false breakout at 1.0888 will provide a good short entry, aiming for a correction down to 1.0827. A break and consolidation below this range would offer another suitable sell setup, targeting 1.0770, marking a substantial correction in the pair. The ultimate target for shorts would be 1.0743, where I plan to take profit. If EUR/USD rises during the U.S. session and bears fail to show strong resistance at 1.0888, buyers may push the pair higher. In that case, I will delay short positions until 1.0952, where I will sell only after a failed consolidation. I plan to sell directly from 1.0997, targeting a 30–35 point downward correction.

This image is no longer relevant

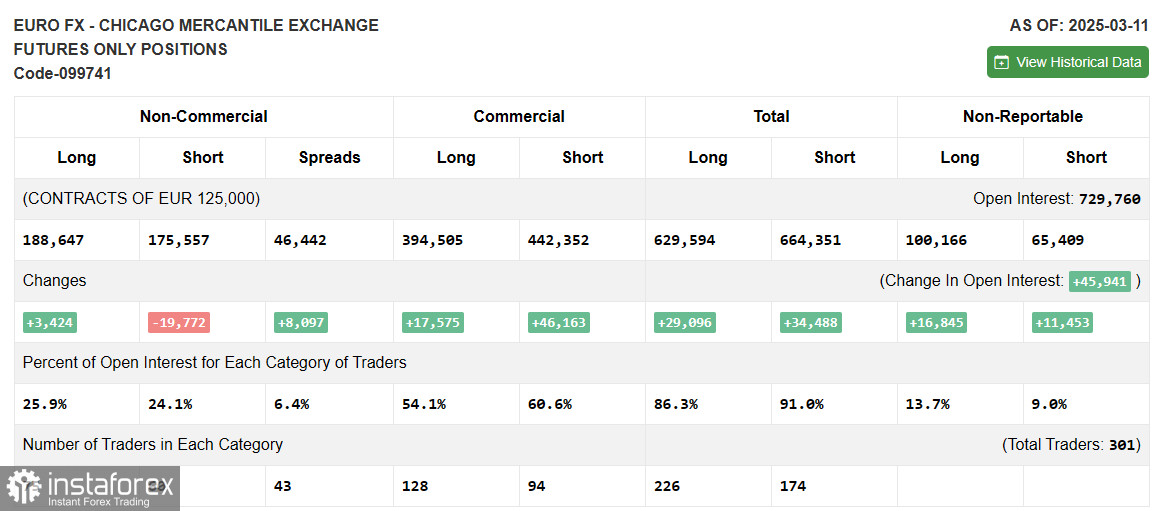
The COT report (Commitment of Traders) for March 11 showed an increase in long positions and a significant reduction in short positions. More traders are eager to buy the euro, while sellers are quickly exiting the market. Germany's fiscal stimulus policy and ECB support measures have boosted demand for the euro. Additionally, progress in resolving the Ukraine conflict adds further optimism. The upcoming Fed meeting will be crucial—if the Fed's stance is more dovish than expected, the dollar could weaken further. The COT report shows that non-commercial long positions increased by 3,424 to 188,647, while non-commercial short positions decreased by 19,772 to 175,557. As a result, the gap between long and short positions expanded by 8,097.

This image is no longer relevant

Indicator Signals:

Moving Averages: Trading is occurring below the 30- and 50-day moving averages, indicating a bearish trend.Note: The author uses the H1 chart to analyze moving averages, which differs from their classic interpretation on the D1 chart.

Bollinger Bands: If the pair declines, support will be provided by the lower Bollinger Band at 1.0849.

Indicator Descriptions: • Moving Average (MA): Determines the current trend by smoothing out volatility and noise. 50-period MA (yellow on the chart), 30-period MA (green on the chart). • MACD (Moving Average Convergence/Divergence): Fast EMA – period 12, Slow EMA – period 26, SMA – period 9. • Bollinger Bands: 20-period setting. • Non-commercial traders: Speculators such as individual traders, hedge funds, and large institutions using the futures market for speculation. • Non-commercial long positions: The total long open positions held by non-commercial traders. • Non-commercial short positions: The total short open positions held by non-commercial traders. • Non-commercial net position: The difference between short and long positions held by non-commercial traders.

Miroslaw Bawulski,
Analytical expert of InstaForex
© 2007-2025
EURUSD
Euro vs US Dollar
Summary
Sell
Urgency
1 day
Analytic
Maxim Magdalinin
Start trade
Earn on cryptocurrency rate changes with InstaForex
Download MetaTrader 4 and open your first trade
  • Chancy Deposit
    Deposit your account with $3,000 and get $1000 more!
    In April we raffle $1000 within the Chancy Deposit campaign!
    Get a chance to win by depositing $3,000 to a trading account. Having fulfilled this condition, you become a campaign participant.
    JOIN CONTEST

Recommended Stories

How to Trade the GBP/USD Pair on April 2? Simple Tips and Trade Analysis for Beginners

Analysis of Tuesday's Trades 1H Chart of GBP/USD On Tuesday, the GBP/USD pair continued trading within a flat range, just as it has for several weeks. The macroeconomic background

Paolo Greco 06:25 2025-04-02 UTC+2

How to Trade the EUR/USD Pair on April 2? Simple Tips and Trade Analysis for Beginners

Analysis of Tuesday's Trades 1H Chart of EUR/USD On Tuesday, the EUR/USD currency pair continued to trade in the same mode as in previous weeks. What does that mean? Relatively

Paolo Greco 06:25 2025-04-02 UTC+2

Trading Recommendations and Analysis for EUR/USD on April 2: Monday Quietly Slipped Into Tuesday

The EUR/USD currency pair traded on Tuesday in the same manner as on Monday. Yesterday, we warned that despite the large number of macroeconomic events, they might not influence

Paolo Greco 04:00 2025-04-02 UTC+2

Trading Recommendations and Analysis for GBP/USD on April 2: The Market Continues to Rest

The GBP/USD currency pair continued to trade similarly on Tuesday, as it has over the last few weeks. All price movements have occurred between 1.2863 and 1.2981 for the past

Paolo Greco 04:00 2025-04-02 UTC+2

GBP/USD: Trading Plan for the U.S. Session on April 1 (Review of Morning Trades)

In my morning forecast, I highlighted the level of 1.2916 and planned to make market entry decisions based on it. Let's look at the 5-minute chart and analyze what happened

Miroslaw Bawulski 19:49 2025-04-01 UTC+2

EUR/USD: Trading Plan for the U.S. Session on April 1st (Review of Morning Trades)

In my morning forecast, I highlighted the level of 1.0815 and planned to make market entry decisions based on it. Let's look at the 5-minute chart and analyze what happened

Miroslaw Bawulski 19:31 2025-04-01 UTC+2

GBP/USD: Trading Plan for the U.S. Session on March 31st (Analysis of Morning Trades)

In my morning forecast, I focused on the 1.2966 level and planned to make trading decisions based on it. Let's look at the 5-minute chart and analyze what happened

Miroslaw Bawulski 19:52 2025-03-31 UTC+2

EUR/USD: Trading Plan for the U.S. Session on March 31st (Analysis of Morning Trades)

In my morning forecast, I highlighted the 1.0829 level and planned to make trading decisions based on it. Let's look at the 5-minute chart to see what happened. A decline

Miroslaw Bawulski 19:50 2025-03-31 UTC+2

How to Trade the GBP/USD Pair on March 31? Simple Tips and Trade Analysis for Beginners

Analysis of Friday's Trades 1H Chart of GBP/USD The GBP/USD pair traded sideways on Friday, unlike the EUR/USD pair. And that's rather strange. For several weeks now, the British pound

Paolo Greco 03:21 2025-03-31 UTC+2

How to Trade the EUR/USD Pair on March 31? Simple Tips and Trade Analysis for Beginners

Analysis of Friday's Trades 1H Chart of EUR/USD On Friday, the EUR/USD currency pair once again traded higher. We can't say that macroeconomic events justified this movement. At this point

Paolo Greco 03:21 2025-03-31 UTC+2
Can't speak right now?
Ask your question in the chat.
Widget callback
 

Dear visitor,

Your IP address shows that you are currently located in the USA. If you are a resident of the United States, you are prohibited from using the services of InstaFintech Group including online trading, online transfers, deposit/withdrawal of funds, etc.

If you think you are seeing this message by mistake and your location is not the US, kindly proceed to the website. Otherwise, you must leave the website in order to comply with government restrictions.

Why does your IP address show your location as the USA?

  • - you are using a VPN provided by a hosting company based in the United States;
  • - your IP does not have proper WHOIS records;
  • - an error occurred in the WHOIS geolocation database.

Please confirm whether you are a US resident or not by clicking the relevant button below. If you choose the wrong option, being a US resident, you will not be able to open an account with InstaForex anyway.

We are sorry for any inconvenience caused by this message.