GBP/USD 5-Minute Analysis
On Monday, the GBP/USD pair exhibited upward movement, even though there were no significant events scheduled in either the UK or the US. During a technical correction, the market often does not require local macroeconomic or fundamental reasons for movement. As a result, the British pound has been rising for three consecutive weeks, despite weak economic data from the UK and the potential for more aggressive monetary policy easing by the Bank of England compared to the Federal Reserve. Like any currency, the pound cannot continually fall or rise indefinitely. On the daily timeframe, the correction has been building for some time and is now developing in proportion to the preceding decline.
From a technical perspective, there isn't much new to report at the moment. The pound may continue to rise on technical grounds for another couple of weeks. However, sustaining this growth could be challenging after the upcoming meetings of the Fed and the Bank of England. The Fed is expected to announce a hawkish rate decision, while the BoE is likely to remain dovish. Looking at the bigger picture, the eventual resumption of a downward trend seems inevitable. Although Donald Trump is actively working to weaken the US dollar, he cannot permanently push it lower.
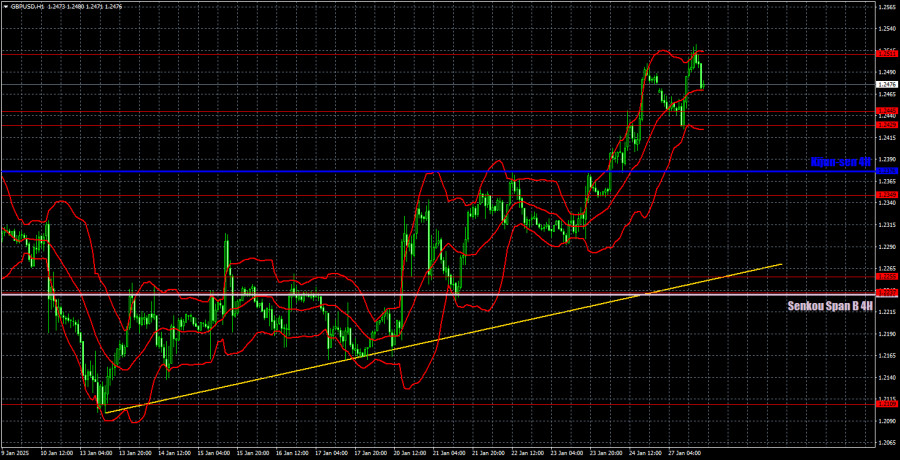
From a technical standpoint, the GBP/USD pair displayed strong movements on Monday. Initially, the price rebounded from the 1.2429–1.2445 zone, which served as a buy signal. It then reached the nearest target at 1.2516 and rebounded again, triggering a sell signal. Traders could have made approximately 40 pips from the first trade and another 30 pips from the second trade if they manually closed their long positions in the evening.
COT Report
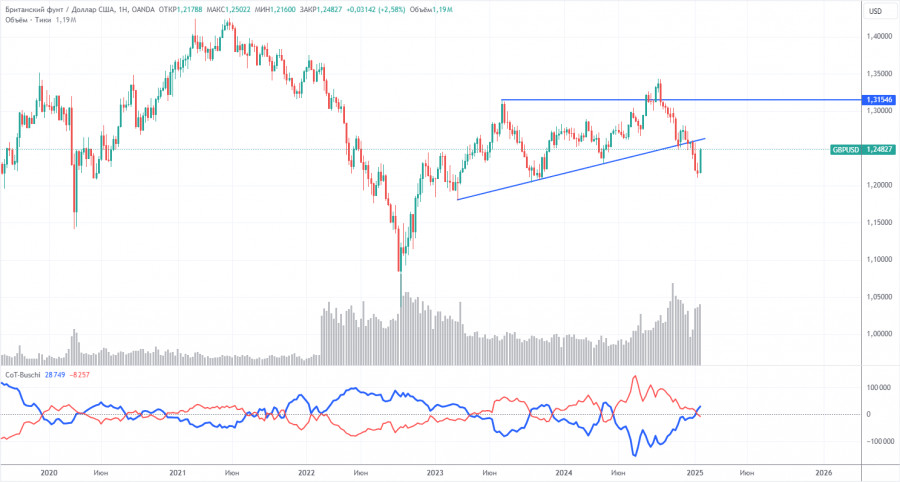
The Commitment of Traders (COT) reports for the British pound indicate that commercial traders' sentiment has fluctuated consistently over recent years. The red and blue lines in the reports, which represent the net positions of commercial and non-commercial traders, frequently intersect and typically remain close to the zero mark. Currently, these lines are near each other, suggesting that the number of buy and sell positions is roughly equal.
On the weekly timeframe, the price initially broke through the 1.3154 level but then retraced back to the trendline, which it successfully breached. This break of the trendline strongly indicates that the decline of the pound is likely to continue. However, there has also been a rebound from the previous local low on the weekly chart, which could point to a range-bound market.
According to the latest COT report, the non-commercial group has closed 4,800 buy contracts and opened 3,800 sell contracts. This resulted in a decrease of 8,600 contracts in the net position of non-commercial traders, which is not a positive sign for the pound.
The fundamental outlook does not provide any justification for long-term purchases of the British pound, and the currency remains at risk of continuing its global downward trend. Consequently, the net position may continue to decline, signaling a further reduction in demand for the British pound.
GBP/USD 1-Hour Analysis
On the hourly timeframe, the GBP/USD pair continues to trade within a local uptrend. While we do not see any long-term factors supporting the growth of the pound sterling, the short-term trend remains upward. Therefore, long positions should be considered on the lower timeframes. However, on higher timeframes and in the long term, we advise against taking long positions. The meetings of the Fed and the BoE scheduled for this and next week could significantly influence market sentiment.
On January 28, we identify the following important levels: 1.2052, 1.2109, 1.2237-1.2255, 1.2349, 1.2429-1.2445, 1.2511, 1.2605-1.2620, 1.2691-1.2701, and 1.2796-1.2816. The Senkou Span B (1.2232) and Kijun-sen (1.2376) lines may also provide useful signals. It is recommended to set the Stop Loss level at breakeven when the price moves 20 pips in the favorable direction. Additionally, keep in mind that the Ichimoku indicator lines may shift during the day, which could affect trading signals.
On Tuesday, there are no significant events scheduled in the UK, while the US will release the durable goods orders report. Although this is an important report, it is unlikely to reverse the local trend.
Illustration Explanations:
- Support and Resistance Levels (thick red lines): Thick red lines indicate where movement may come to an end. Please note that these lines are not sources of trading signals.
- Kijun-sen and Senkou Span B Lines: Ichimoku indicator lines transferred from the 4-hour timeframe to the hourly timeframe. These are strong lines.
- Extreme Levels (thin red lines): Thin red lines where the price has previously bounced. These serve as sources of trading signals.
- Yellow Lines: Trendlines, trend channels, or any other technical patterns.
- Indicator 1 on COT Charts: Represents the net position size for each category of traders.


