Pasangan mata wang GBP/USD - Carta 5 Minit
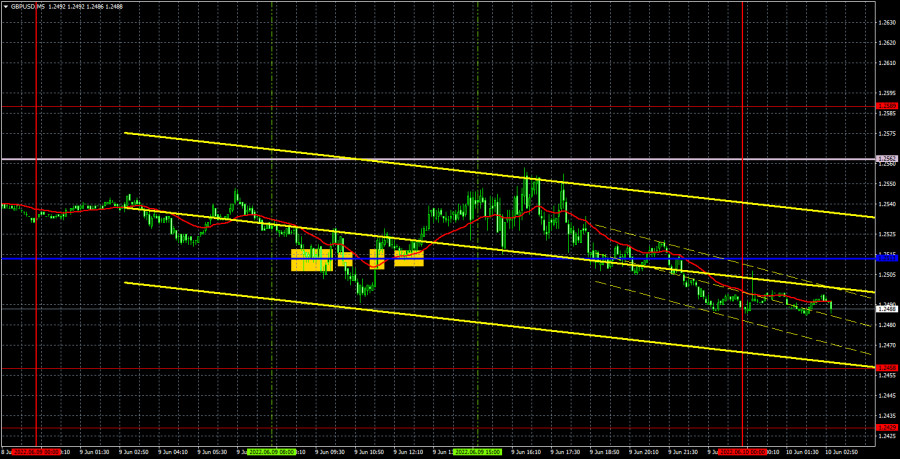
Pasangan mata wang GBP/USD tidak menunjukkan apa-apa yang menarik pada hari Khamis. Pergerakan yang tidak dapat difahami telah diperhatikan sepanjang hari, yang sukar untuk diklasifikasikan seperti mendatar, tetapi anda juga tidak boleh memanggilnya trend. Pedagang tidak mengendahkan indikator garis Ichimoku, yang tidak menghairankan, kerana kami mempunyai titik mendatar yang jelas pada carta masa. Atau "ayunan." Satu cara atau yang lain, tetapi apabila harga bergerak terutamanya dalam aliran mendatar, tidak perlu bercakap tentang pergerakan yang baik atau isyarat yang baik. Selain itu, tiada satu pun laporan makroekonomi penting diterbitkan pada siang hari. Oleh itu, volatiliti pasaran adalah rendah. Oleh itu, adalah tidak mungkin untuk membuat sebarang kesimpulan berprofil tinggi. Anda perlu menunggu pasangan mata wang ini meninggalkan saluran mendatar atau berdagang dari sempadannya ke lantunan.
Terdapat beberapa isyarat dagangan pada hari Khamis, tetapi semuanya sangat tidak tepat. Ini juga tidak menghairankan, kerana kesemuanya telah dibentuk berhampiran garis kritikal, yang bukan merupakan sumber isyarat dagangan yang baik dalam aliran mendatar, yang telah kita bincangkan dalam artikel lepas. Akibatnya, semua isyarat kecuali yang terakhir adalah palsu. Anda boleh mencuba dua yang pertama sahaja, dan walaupun anda mengabaikan pengesyoran kami tentang berhati-hati semasa membuka pesanan. Kerana walaupun isyarat pertama menunjukkan bahawa pasaran tidak tahu apa yang perlu dilakukan dengan pasangan mata wang ini. Adalah mustahil untuk memahami apa itu: lantunan dari garis Kijun-Sen atau kejayaannya. Oleh itu, adalah lebih baik untuk memintas isyarat ini. Isyarat kedua untuk membuka pesanan menjual membawa kepada kejatuhan pada 17 mata, yang tidak mencukupi untuk meletakkan pesanan Stop Loss ke titik pulang modal.
Laporan COT:
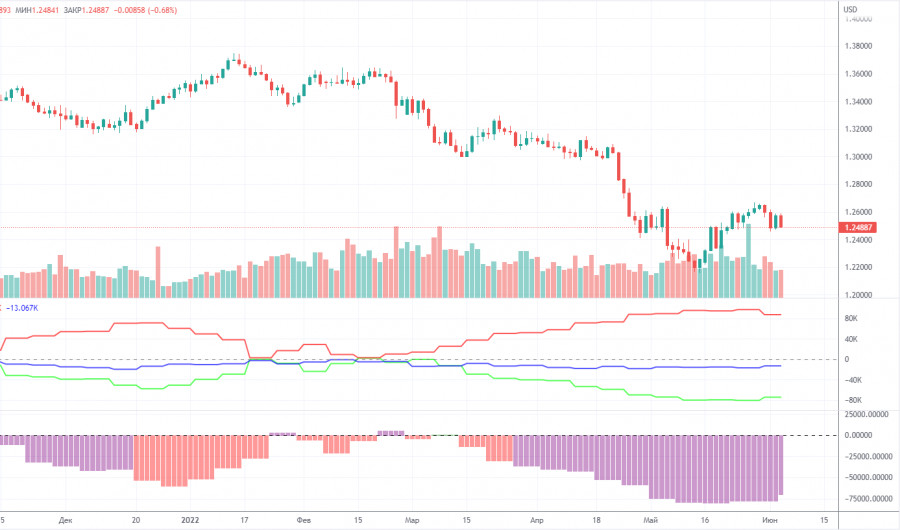
Laporan Komitmen Pedagang (COT) terkini mengenai pound British menunjukkan perubahan yang minimum. Pada minggu itu, kumpulan bukan komersial membuka 4,800 pesanan membeli dan menutup 1,400 pesanan menjual. Oleh itu, pesanan bersih bukan komersial meningkat sebanyak 6,200, buat kali pertama dalam masa yang lama. Pesanan bersih telah jatuh selama tiga bulan, yang digambarkan dengan sempurna oleh garis hijau indikator pertama dalam carta di atas atau histogram indikator kedua. Oleh itu, satu peningkatan dalam indikator ini tidak mungkin menunjukkan dengan jelas akhir arah aliran menurun untuk pound. Kumpulan bukan komersial itu telah membuka sejumlah 105,000 pesanan menjual dan hanya 31,000 pesanan membeli. Oleh itu, perbezaan antara nombor ini sudah lebih daripada tiga kali ganda. Ini bermakna bahawa mood di kalangan pedagang profesional kini kekal "menurun". Kami ambil perhatian bahawa dalam kes pound, data COT sangat tepat menggambarkan apa yang berlaku di pasaran: mood pedagang adalah "sangat menurun", dan pound telah jatuh berbanding dolar AS untuk masa yang lama. Dalam beberapa minggu yang lalu, pound telah menunjukkan pertumbuhan, tetapi walaupun dalam carta untuk perenggan ini (carta harian), pergerakan ini kelihatan sangat lemah. Memandangkan dalam kes pound, laporan COT mencerminkan gambaran sebenar sesuatu, kami perhatikan bahawa perbezaan yang kuat bagi indikator pertama garis merah dan hijau selalunya bermakna tamat aliran. Oleh itu, secara rasmi sekarang kita boleh bergantung pada aliran menaik yang baharu. Walau bagaimanapun, latar belakang geopolitik, asas dan makroekonomi yang lemah untuk mata wang Eropah mungkin sekali lagi memberi tekanan kepada mereka.
Kami mengesyorkan kepada para pedagang untuk membiasakan diri dengan:
Gambaran keseluruhan pasangan mata wang EUR/USD. 10 Jun. Dijangka dan boleh diramal: ECB tidak menaikkan kadar, tetapi memberi harapan kepada pedagang.
Gambaran keseluruhan untuk pasangan mata wang GBP/USD. 10 Jun. Bank pusat dunia secara serentak terlepas inflasi dan kini meraih faedah.
Ramalan dan isyarat dagangan untuk pasangan mata wang EUR/USD pada 10 Jun. Analisis terperinci pergerakan pasangan mata wang dan urus niaga dagangan.
Pasangan mata wang GBP/USD - Carta 1 Jam

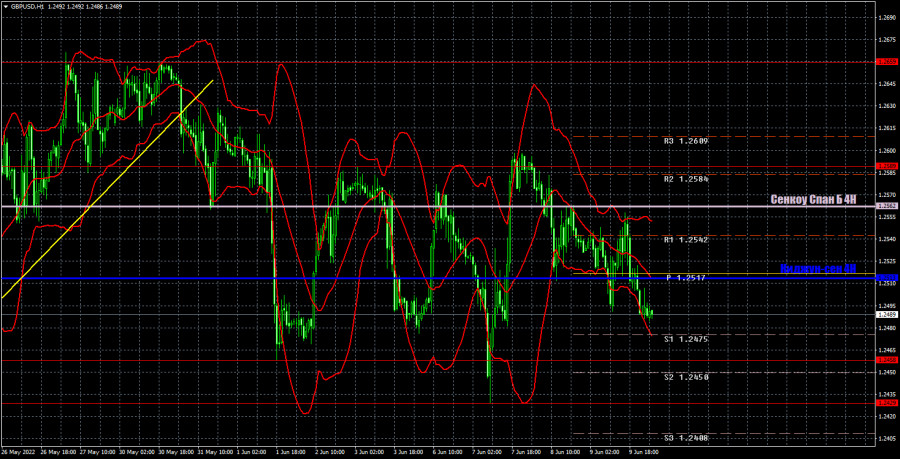
Pasangan mata wang ini sudah pasti berdagang dalam mod "ayunan" pada carta 1 Jam, yang membawa kepada membentuk isyarat palsu, dan indikator garis Ichimoku kehilangan kekuatannya. Oleh itu, anda harus berhati-hati apabila membuka sebarang pesanan. Adalah lebih baik untuk membentuk isyarat yang paling tepat dan kuat - sebaiknya untuk lantunan semula daripada tahap 1.2458 dan 1.2589. Hari ini, kami membezakan tahap penting berikut: 1.2259, 1.2429, 1.2458, 1.2589, 1.2659. Senkou Span B (1.2562) dan Kijun-Sen (1.2513) juga boleh menjadi sumber isyarat. Isyarat boleh menjadi "lantunan" dan "penembusan" harga pada tahap dan garis ini. Adalah disyorkan untuk menetapkan pesanan Stop Loss ke titik pulang modal apabila harga melepasi arah yang betul sebanyak 20 mata. Indikator garis Ichimoku boleh bergerak pada siang hari, yang harus diambil kira semasa menentukan isyarat dagangan. Terdapat juga tahap sokongan dan rintangan pada carta yang boleh digunakan untuk mengambil keuntungan pada urus niaga. Tiada apa-apa yang menarik dirancang untuk hari Jumaat di UK. Laporan inflasi akan dikeluarkan di Amerika, tetapi ia akan menimbulkan reaksi daripada peniaga hanya jika nilai sebenar adalah sangat berbeza daripada ramalan. Kita boleh melihat turun naik yang baik, tetapi pasangan mata wang ini berkemungkinan besar akan kekal di dalam saluran mendatar.
Penjelasan carta:
Tahap Sokongan dan Rintangan ialah tahap yang berfungsi sebagai sasaran apabila membuka pesanan membeli atau menjual pasangan mata wang. Anda boleh meletakkan pesanan Take Profit berhampiran pada tahap ini.
Garis Kijun-sen dan Senkou Span B ialah garis indikator Ichimoku yang dipindahkan ke carta 1 Jam daripada carta 4 Jam.
Kawasan sokongan dan rintangan ialah kawasan harga di mana ia telah melantun semula.
Garis kuning ialah garis arah aliran, saluran aliran dan sebarang corak teknikal lain.
Indikator 1 pada carta COT ialah volume pesanan bersih bagi setiap kategori pedagang.
Indikator 2 pada carta COT ialah volume pesanan bersih untuk kumpulan bukan komersial.


