empty
27.01.2025 01:03 PM
Forecast for GBP/USD on January 27, 2025

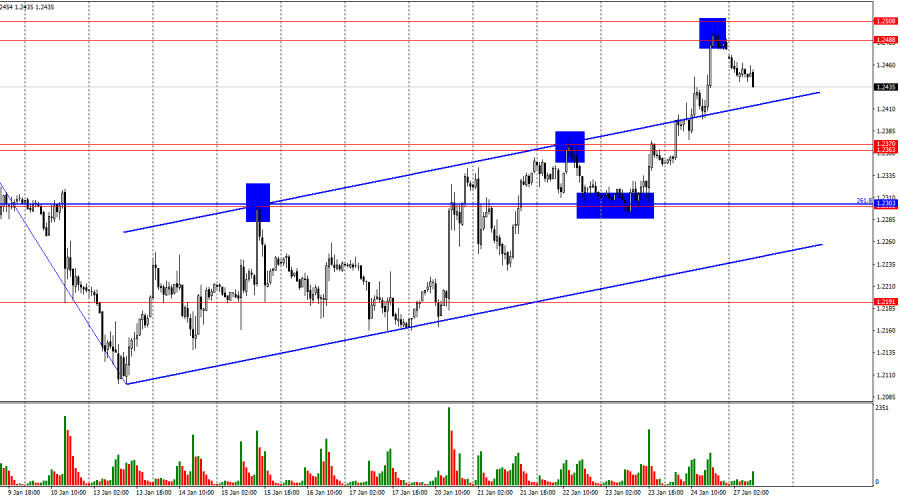
On the hourly chart, GBP/USD closed above the resistance zone of 1.2363–1.2370 on Friday and rose toward the resistance zone of 1.2488–1.2508. A rebound from this zone worked in favor of the U.S. dollar, initiating a new decline toward the 1.2363–1.2370 zone. The upward trend channel continues to indicate a bullish market sentiment. The pound is maximizing its growth opportunities.

This image is no longer relevant

The situation with the waves is quite clear. The last completed downward wave broke the low of the previous wave, while the most recent upward wave has not yet approached the previous peak. Thus, a bearish trend is still forming, and there is no doubt about this. For this trend to reverse, the pound must rise to at least the 1.2569 level and close confidently above it. While this is possible, discrepancies between the euro and the pound waves exist, meaning one of the structures is likely to be invalidated.

Friday's news from the UK wasn't particularly positive, consistent with the overall tone of January. Business activity indices showed slight growth, but it's unlikely these figures triggered such a strong bullish move. More likely, it is the U.S. dollar bears (bulls for GBP/USD) who remain cautious of Donald Trump and his decisions.

However, this week, the dollar will have opportunities to recover. The upcoming Federal Reserve (Fed) meeting is expected to be hawkish, as the regulator does not plan to ease monetary policy. While the market may be selling the dollar due to Trump, this factor is vague and unlikely to consistently pressure the U.S. currency.

In my opinion, the upcoming meetings of the Bank of England (BoE) and the Fed, along with statements from Jerome Powell and Andrew Bailey, will play a more significant role over the next two weeks. If traders sense Trump's limited influence on the Fed, dollar bears may launch a strong offensive. Of course, this must be confirmed by graphical signals.

This image is no longer relevant

4-Hour Chart Analysis:

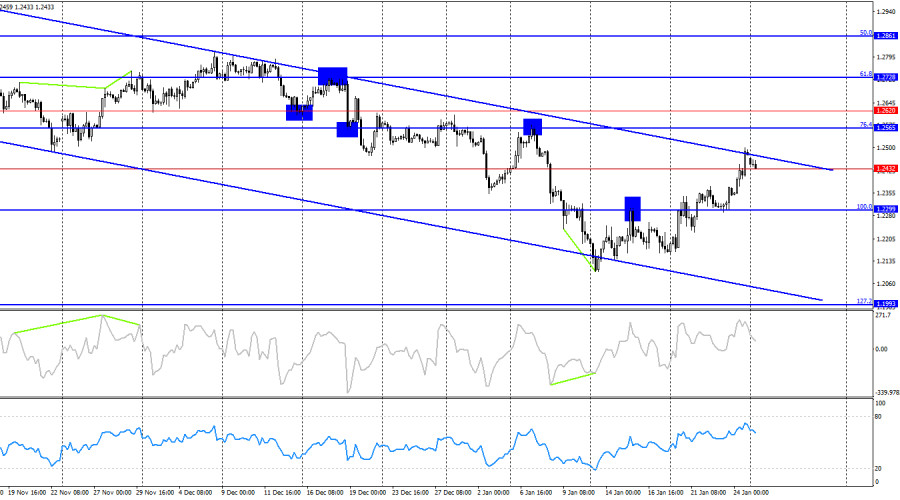
The pair continues to rise within a downward trend channel. A rebound from the channel's upper boundary could trigger a reversal in favor of the U.S. dollar and initiate a decline toward at least the Fibonacci level of 100.0% at 1.2299. If the pair consolidates above the channel, it could push bears out of the market entirely. However, for bulls to sustain momentum, continuous positive news from the UK or negative news from the U.S. will be necessary—an unlikely scenario at the moment. No divergences are observed in any indicators today.

Commitments of Traders (COT) Report:

This image is no longer relevant

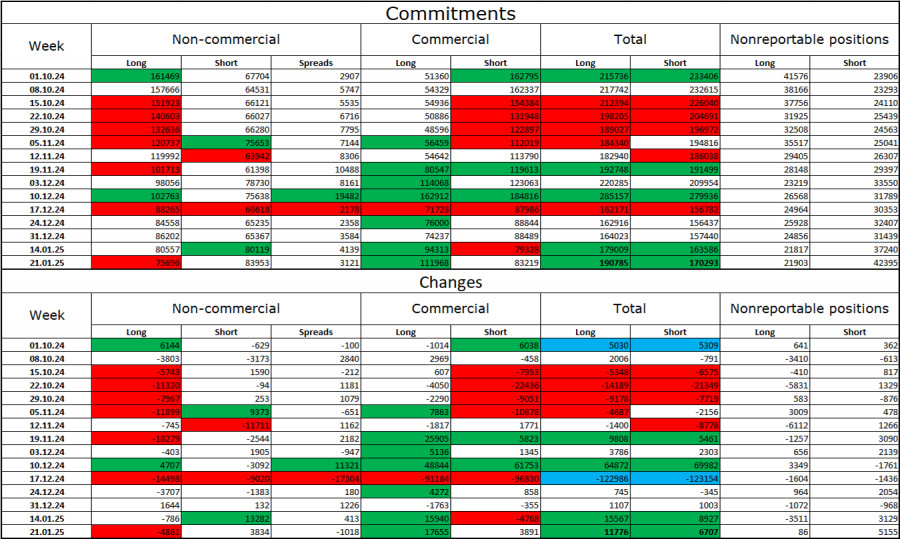
The sentiment of the "Non-commercial" category of traders became significantly more bearish in the last reporting week. The number of long positions held by speculators decreased by 4,861, while short positions grew by 3,834. Bulls have lost their advantage on the market—a process that has been ongoing for several months. The gap between long and short positions now favors the bears: 75,000 versus 84,000.

In my view, the pound still has downward potential, and the COT reports indicate a strengthening of bearish positions nearly every week. Over the past three months, the number of long positions has dropped from 161,000 to 75,000, while the number of short positions has increased from 67,000 to 84,000. I believe professional players will continue to reduce long positions or increase short positions over time, as all possible factors for buying the British pound have already been priced in.

Graphical analysis currently signals growth, but corrections should also be expected.

News Calendar for the UK and the U.S.:

On Monday, the economic calendar does not feature any significant events. As such, the information background will not influence trader sentiment for the rest of the day.

GBP/USD Forecast and Recommendations for Traders:

  • Sales: Consider selling the pair if it consolidates below the upward trend channel on the hourly chart. Sales were also possible after a rebound from the 1.2488–1.2508 level, but the local trend remains bullish.
  • Purchases: Buying the pound is possible today after a rebound from the 1.2363–1.2370 zone on the hourly chart, targeting 1.2488–1.2508.

Fibonacci levels are plotted from 1.3000–1.3432 on the hourly chart and from 1.2299–1.3432 on the 4-hour chart.

Pilih carta masa
5
min
15
min
30
min
1
jam
4
jam
1
hari
1
minggu
Jana pendapatan melalui perubahan kadar mata wang kripto dengan InstaForex.
Muat turun MetaTrader 4 dan buka dagangan pertama anda.
  • Grand Choice
    Contest by
    InstaForex
    InstaForex always strives to help you
    fulfill your biggest dreams.
    SERTAI PERADUAN

Artikel yang dicadangkan

Ramalan untuk EUR/USD pada 31 Januari 2025

Dalam mesyuarat semalam, Bank Pusat Eropah telah menurunkan kadar faedah utamanya sebanyak 0.25% seperti yang dijangkakan. Dalam kenyataan yang disertakan, bank pusat tersebut menekankan komitmennya terhadap dasar yang ketat, yang

Laurie Bailey 04:01 2025-01-31 UTC+2

Ramalan untuk GBP/USD pada 31 Januari 2025

Pound British tidak mengatasi euro dalam penurunannya secara beransur-ansur selepas mesyuarat Bank Pusat Eropah baru-baru ini. Ia telah mengesahkan pengukuhannya di bawah garis penunjuk keseimbangan dan MACD. Untuk pound bergerak

Laurie Bailey 04:01 2025-01-31 UTC+2

Ramalan untuk USD/JPY pada 31 Januari 2025

Yen secara beransur-ansur bergerak ke arah sempadan bawah saluran harga hijaunya, menyasarkan tahap 147.22. Julat sasaran awal adalah antara 151.30 dan 151.92, yang sepadan dengan paras terendah yang direkodkan pada

Laurie Bailey 04:01 2025-01-31 UTC+2

Ramalan untuk ZC (Jagung) pada 31 Januari 2025

Pada carta harian untuk kontrak niaga hadapan jagung bulan Mac, terdapat pembalikan yang ketara. Grid Fibonacci, yang diterapkan kepada keseluruhan pergerakan dari paras rendah bulan Ogos tahun lepas, menunjukkan struktur

Laurie Bailey 04:01 2025-01-31 UTC+2

Ramalan untuk GBP/USD pada 30 Januari 2025

Pada carta setiap jam, GBP/USD cuba untuk menurun ke arah zon sokongan 1.2363–1.2370 pada hari Rabu tetapi gagal mengekalkan pergerakan tersebut. Satu lagi percubaan untuk menguji tahap ini mungkin akan

Samir Klishi 12:00 2025-01-30 UTC+2

Ramalan untuk EUR/USD pada 30 Januari 2025

Pada hari Rabu, pasangan EUR/USD terus didagangkan di bawah tahap penarikan semula Fibonacci 100.0% pada 1.0437, menembusi saluran aliran menaik. Ini menunjukkan bahawa penjual mungkin segera mengambil alih kawalan, dengan

Samir Klishi 11:59 2025-01-30 UTC+2

Analisis Teknikal Pergerakan Harga Harian Indeks Nasdaq 100, Khamis 30 Januari 2025.

Walaupun pada carta 4 jam indeks Nasdaq 100 bergerak dalam keadaan mendatar, kemunculan penumpuan antara pergerakan harga #NDX dan indikator Awesome Oscillator memberikan petunjuk bahawa dalam masa terdekat akan

Arief Makmur 08:36 2025-01-30 UTC+2

Analisis Teknikal Pergerakan Harga HarianPasangan Mata Wang Utama USD/JPY, Khamis 30 Januari 2025.

```html Jika kita melihat carta 4 jam bagi pasangan mata wang utama USD/JPY, terdapat beberapa perkara menarik, pertama adalah kemunculan corak Failing Wedge, kedua adalah perbezaan antara pergerakan harga USD/JPY

Arief Makmur 08:36 2025-01-30 UTC+2

Bitcoin 30 Januari - Analisis Teknikal Situasi

Bitcoin mencapai tahap tertinggi baru minggu lalu pada 109,986 tetapi sejak itu berhenti dari pergerakan ke atasnya, memasuki fasa ketidakpastian. Pada masa ini, bayangan bawah yang panjang telah terbentuk pada

Evangelos Poulakis 05:56 2025-01-30 UTC+2

Isyarat Dagangan untuk EMAS (XAU/USD) bagi 30-31 Januari 2025: jual di bawah $2,755 (21 SMA - 6/8 Murray)

Di awal sesi Eropah, emas didagangkan sekitar 2,760, di atas 21 SMA, dan berada dalam saluran aliran menurun yang terbentuk sejak 23 Januari. Dari segi teknikal, emas menunjukkan isyarat positif

Dimitrios Zappas 05:01 2025-01-30 UTC+2
Tidak boleh bertanya sekarang?
Tanya soalan anda di Ruangan bersembang.
Panggilan semula Widget
 

Dear visitor,

Your IP address shows that you are currently located in the USA. If you are a resident of the United States, you are prohibited from using the services of InstaFintech Group including online trading, online transfers, deposit/withdrawal of funds, etc.

If you think you are seeing this message by mistake and your location is not the US, kindly proceed to the website. Otherwise, you must leave the website in order to comply with government restrictions.

Why does your IP address show your location as the USA?

  • - you are using a VPN provided by a hosting company based in the United States;
  • - your IP does not have proper WHOIS records;
  • - an error occurred in the WHOIS geolocation database.

Please confirm whether you are a US resident or not by clicking the relevant button below. If you choose the wrong option, being a US resident, you will not be able to open an account with InstaForex anyway.

We are sorry for any inconvenience caused by this message.