empty
27.01.2025 01:07 PM
Forecast for EUR/USD on January 27, 2025

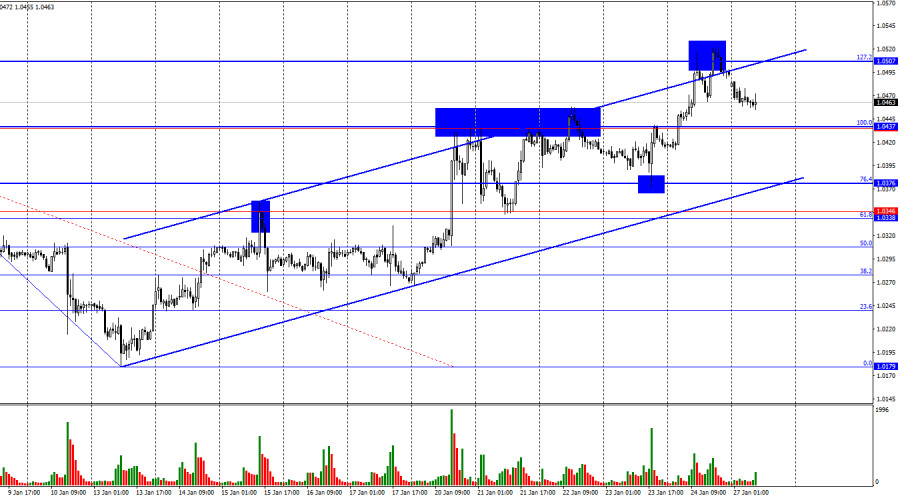
On Friday, the EUR/USD pair continued its upward movement, consolidating above the 100.0% Fibonacci retracement level at 1.0437 and testing the 127.2% Fibonacci level at 1.0507. A rebound from this level worked in favor of the U.S. dollar, leading to a decline toward the 1.0437 level. The upward trend channel confirms the bullish sentiment in the market.

This image is no longer relevant

The situation with the waves remains clear. The last completed downward wave broke the low of the previous wave, while the latest upward wave (still incomplete) has surpassed the previous two peaks. This confirms the completion of the bearish trend. A new downward wave could soon begin forming, but for the bears to establish a new trend, the price needs to return to the 1.0179 level or form a more complex wave structure that takes control.

The information flow on Friday was favorable for the bulls but not outstanding. I believe bullish traders exceeded expectations for both Friday and the entire past week. The euro appreciated too significantly, considering the informational backdrop, which was mostly absent on most days. By information background, I mean economic data. However, it's possible the market was trading "on Trump." If so, trader sentiment will soon depend on this factor.

On Friday, Germany's business activity indices delivered better-than-expected results, as did those for the Eurozone. U.S. indices were also decent but fell short of their European counterparts. Additionally, the University of Michigan Consumer Sentiment Index came in weaker than traders expected. While the dollar's decline was justified, it was overly strong.

This week will be pivotal, with the ECB and Federal Reserve meetings on the agenda. ECB President Christine Lagarde will deliver speeches almost daily, and news from Donald Trump will likely continue to flood in. Thus, there will be ample news, and its influence on trader sentiment will be significant.

This image is no longer relevant

4-Hour Chart Analysis:

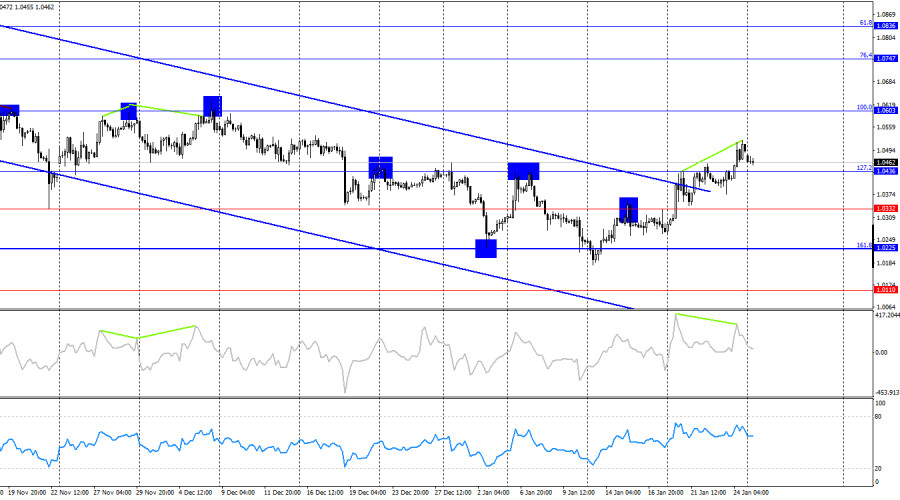
On the 4-hour chart, the pair consolidated above the 127.2% Fibonacci retracement level at 1.0436. This suggests that the upward movement could continue toward the next Fibonacci level of 100.0% at 1.0603. The euro has also broken above the downward trend channel, indicating a gradual shift to a bullish trend. However, how long this bullish trend will last remains unclear. A bearish divergence on the CCI indicator signals a potential decline in the near term.

Commitments of Traders (COT) Report:

This image is no longer relevant

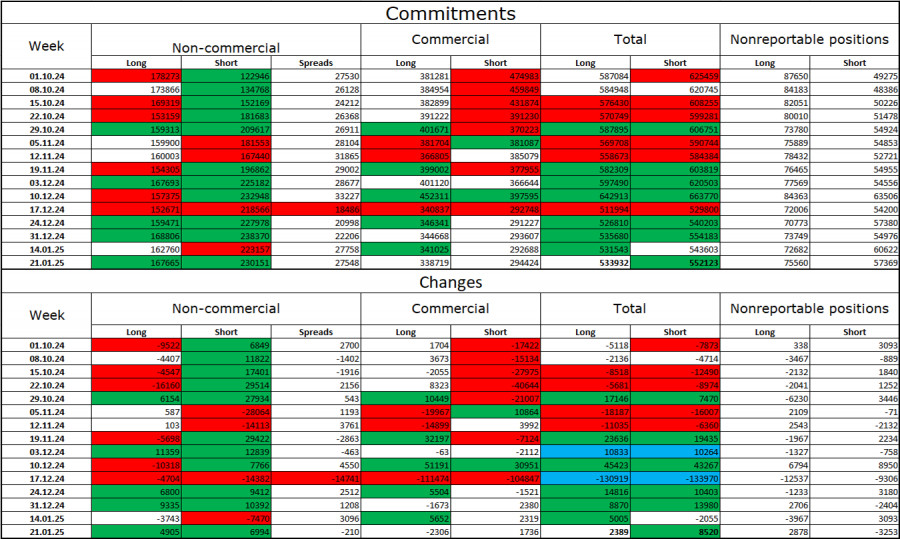
In the latest reporting week, professional players opened 4,905 long positions and 6,994 short positions. The sentiment of the "Non-commercial" group remains bearish, suggesting a potential continuation of the pair's decline. The total number of long positions held by speculators now stands at 167,000, while short positions amount to 230,000.

For 18 consecutive weeks, major players have been selling the euro. This signifies a bearish trend without exception. While bulls occasionally dominate for individual weeks, these instances are exceptions rather than the rule. The key driver of the dollar's weakness—expectations of monetary policy easing by the Federal Reserve—has already been priced in. Unless new reasons to sell the dollar emerge, the U.S. currency's recovery remains more likely.

News Calendar for the U.S. and Eurozone:

  • Eurozone: ECB President Christine Lagarde's Speech (15:35 UTC).

On January 27, the economic calendar contains just one notable event, but it is significant enough to moderately impact market sentiment.

EUR/USD Forecast and Recommendations for Traders:

  • Sales: Selling the pair is advisable after consolidation below the upward trend channel on the hourly chart.
  • Purchases: Buying opportunities were available after a rebound from the 1.0336–1.0346 zone, targeting 1.0435–1.0448, and this target has already been reached. New buying opportunities arise upon a bounce from the 1.0437 level on the hourly chart, targeting 1.0507.

Fibonacci levels are plotted from 1.0437–1.0179 on the hourly chart and from 1.0603–1.1214 on the 4-hour chart.

Pilih carta masa
5
min
15
min
30
min
1
jam
4
jam
1
hari
1
minggu
Jana pendapatan melalui perubahan kadar mata wang kripto dengan InstaForex.
Muat turun MetaTrader 4 dan buka dagangan pertama anda.
  • Grand Choice
    Contest by
    InstaForex
    InstaForex always strives to help you
    fulfill your biggest dreams.
    SERTAI PERADUAN

Artikel yang dicadangkan

Ramalan untuk EUR/USD pada 31 Januari 2025

Dalam mesyuarat semalam, Bank Pusat Eropah telah menurunkan kadar faedah utamanya sebanyak 0.25% seperti yang dijangkakan. Dalam kenyataan yang disertakan, bank pusat tersebut menekankan komitmennya terhadap dasar yang ketat, yang

Laurie Bailey 04:01 2025-01-31 UTC+2

Ramalan untuk GBP/USD pada 31 Januari 2025

Pound British tidak mengatasi euro dalam penurunannya secara beransur-ansur selepas mesyuarat Bank Pusat Eropah baru-baru ini. Ia telah mengesahkan pengukuhannya di bawah garis penunjuk keseimbangan dan MACD. Untuk pound bergerak

Laurie Bailey 04:01 2025-01-31 UTC+2

Ramalan untuk USD/JPY pada 31 Januari 2025

Yen secara beransur-ansur bergerak ke arah sempadan bawah saluran harga hijaunya, menyasarkan tahap 147.22. Julat sasaran awal adalah antara 151.30 dan 151.92, yang sepadan dengan paras terendah yang direkodkan pada

Laurie Bailey 04:01 2025-01-31 UTC+2

Ramalan untuk ZC (Jagung) pada 31 Januari 2025

Pada carta harian untuk kontrak niaga hadapan jagung bulan Mac, terdapat pembalikan yang ketara. Grid Fibonacci, yang diterapkan kepada keseluruhan pergerakan dari paras rendah bulan Ogos tahun lepas, menunjukkan struktur

Laurie Bailey 04:01 2025-01-31 UTC+2

Ramalan untuk GBP/USD pada 30 Januari 2025

Pada carta setiap jam, GBP/USD cuba untuk menurun ke arah zon sokongan 1.2363–1.2370 pada hari Rabu tetapi gagal mengekalkan pergerakan tersebut. Satu lagi percubaan untuk menguji tahap ini mungkin akan

Samir Klishi 12:00 2025-01-30 UTC+2

Ramalan untuk EUR/USD pada 30 Januari 2025

Pada hari Rabu, pasangan EUR/USD terus didagangkan di bawah tahap penarikan semula Fibonacci 100.0% pada 1.0437, menembusi saluran aliran menaik. Ini menunjukkan bahawa penjual mungkin segera mengambil alih kawalan, dengan

Samir Klishi 11:59 2025-01-30 UTC+2

Analisis Teknikal Pergerakan Harga Harian Indeks Nasdaq 100, Khamis 30 Januari 2025.

Walaupun pada carta 4 jam indeks Nasdaq 100 bergerak dalam keadaan mendatar, kemunculan penumpuan antara pergerakan harga #NDX dan indikator Awesome Oscillator memberikan petunjuk bahawa dalam masa terdekat akan

Arief Makmur 08:36 2025-01-30 UTC+2

Analisis Teknikal Pergerakan Harga HarianPasangan Mata Wang Utama USD/JPY, Khamis 30 Januari 2025.

```html Jika kita melihat carta 4 jam bagi pasangan mata wang utama USD/JPY, terdapat beberapa perkara menarik, pertama adalah kemunculan corak Failing Wedge, kedua adalah perbezaan antara pergerakan harga USD/JPY

Arief Makmur 08:36 2025-01-30 UTC+2

Bitcoin 30 Januari - Analisis Teknikal Situasi

Bitcoin mencapai tahap tertinggi baru minggu lalu pada 109,986 tetapi sejak itu berhenti dari pergerakan ke atasnya, memasuki fasa ketidakpastian. Pada masa ini, bayangan bawah yang panjang telah terbentuk pada

Evangelos Poulakis 05:56 2025-01-30 UTC+2

Isyarat Dagangan untuk EMAS (XAU/USD) bagi 30-31 Januari 2025: jual di bawah $2,755 (21 SMA - 6/8 Murray)

Di awal sesi Eropah, emas didagangkan sekitar 2,760, di atas 21 SMA, dan berada dalam saluran aliran menurun yang terbentuk sejak 23 Januari. Dari segi teknikal, emas menunjukkan isyarat positif

Dimitrios Zappas 05:01 2025-01-30 UTC+2
Tidak boleh bertanya sekarang?
Tanya soalan anda di Ruangan bersembang.
Panggilan semula Widget
 

Dear visitor,

Your IP address shows that you are currently located in the USA. If you are a resident of the United States, you are prohibited from using the services of InstaFintech Group including online trading, online transfers, deposit/withdrawal of funds, etc.

If you think you are seeing this message by mistake and your location is not the US, kindly proceed to the website. Otherwise, you must leave the website in order to comply with government restrictions.

Why does your IP address show your location as the USA?

  • - you are using a VPN provided by a hosting company based in the United States;
  • - your IP does not have proper WHOIS records;
  • - an error occurred in the WHOIS geolocation database.

Please confirm whether you are a US resident or not by clicking the relevant button below. If you choose the wrong option, being a US resident, you will not be able to open an account with InstaForex anyway.

We are sorry for any inconvenience caused by this message.