EUR/USD
Analysis:
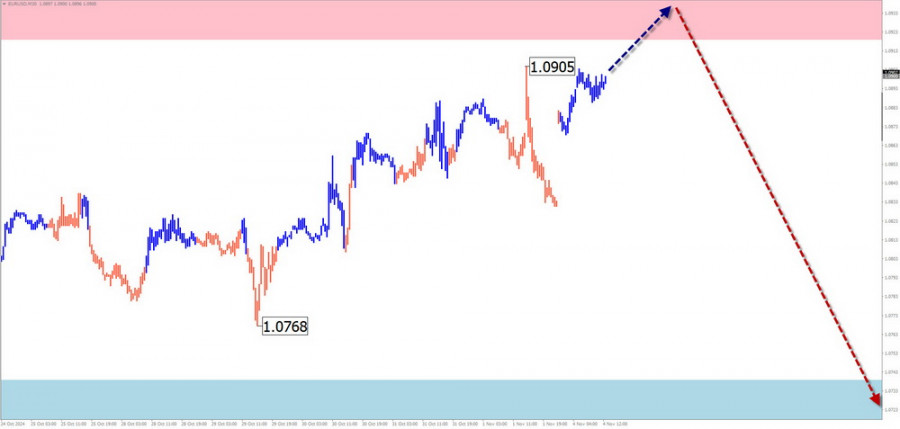
In the short term, the main wave structure for the euro shows an upward trend that started in mid-April this year. Over the last two months, a correction has been forming, with wave extremes creating an extended flat pattern on the chart. This wave structure is in its final phase of formation, with the price heading toward the support zone on the daily timeframe.
Forecast:
For the upcoming week, the main direction for the euro is expected to be predominantly sideways. In the next couple of days, a decline and temporary pressure on the support level are possible, followed by a reversal and potential price increase up to the projected resistance. Increased volatility is expected in the second half of the week.
Potential Reversal Zones
Resistance:
Support:
Recommendations:
Buying: Consider after confirmed signals appear around the support zone.
Selling: Possible within intraday trading, with limited potential.
USD/JPY
Analysis:
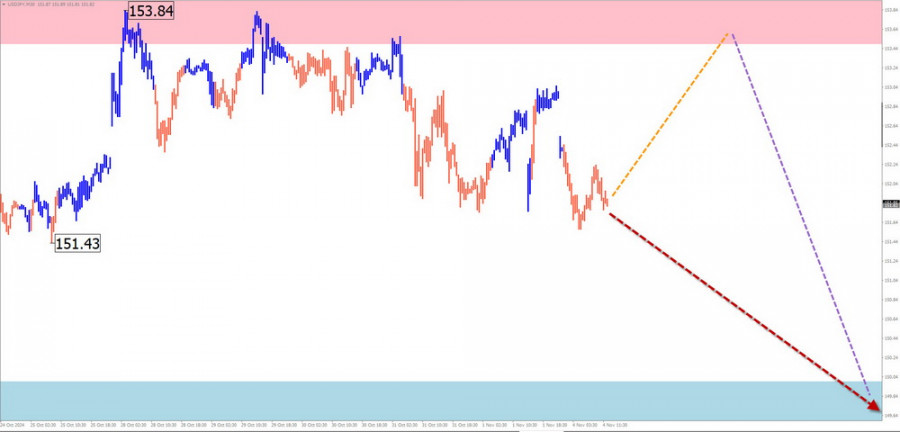
The trend of weakening the Japanese yen against the U.S. dollar has been evident since the beginning of last year. The current upward wave began on August 5. The quotes have reached the lower boundary of a significant potential reversal zone on a larger scale. Although the wave structure appears complete, there are no signals of a trend change on the chart.
Forecast:
At the start of the week, the most likely scenario is continued sideways movement along the resistance zone. A reversal and the beginning of a decline could be expected afterward. The weekly downward range is limited by the calculated support level.
Potential Reversal Zones
Resistance:
Support:
Recommendations:
Selling: Recommended after corresponding signals from your trading systems appear around the resistance area.
Buying: Risky due to limited potential and could lead to losses.
GBP/JPY
Analysis:
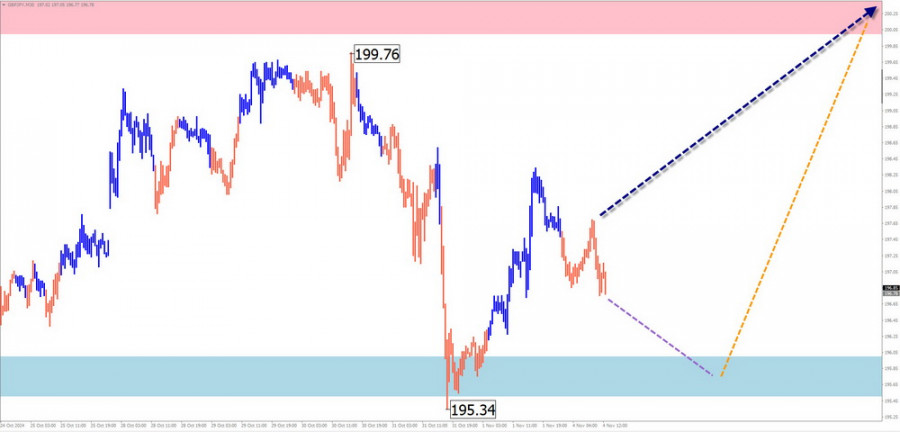
The daily chart for the GBP/JPY pair shows a dominant upward trend over the past three months. The current incomplete section began on September 16. Over the last three weeks, the quotes have been forming an intermediate correction (B) as an extended flat pattern. This wave section is not yet complete.
Forecast:
In the early days of the upcoming week, sideways movement with a downward vector is likely. The price movement down could reach the upper boundary of the support zone. A reversal and renewed price growth could follow in the second half of the week, with a possible price increase up to the resistance zone.
Potential Reversal Zones
Resistance:
Support:
Recommendations:
Selling: Low potential, safer to reduce trading volume size.
Buying: Possible after corresponding signals from your trading systems appear.
USD/CAD
Analysis:
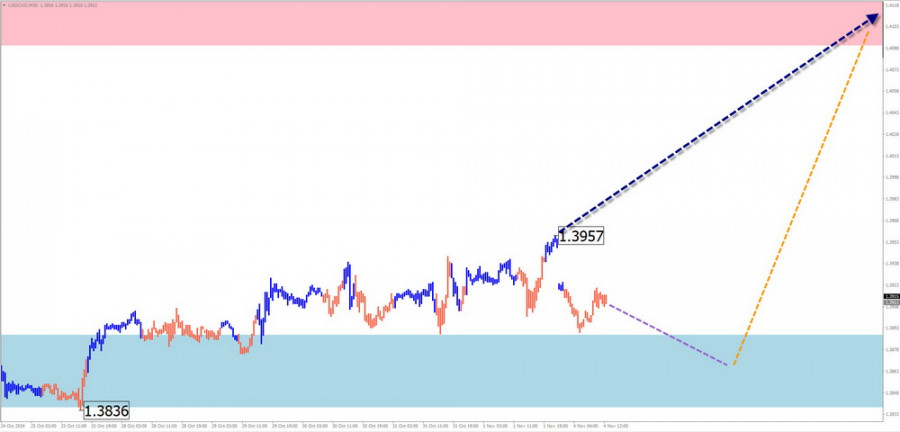
The USD/CAD pair has been developing an upward wave that began at the end of last year. The current incomplete (C) wave started on September 25, following an extended corrective flat. The price broke through a significant resistance level, which has now become support.
Forecast:
In the next couple of days, a transition to a sideways movement is expected, possibly with a decline toward the support zone. A halt and formation of reversal conditions may occur at this level. A directional change is more likely towards the end of the week. The resistance levels outline the upper boundary of the expected weekly price movement.
Potential Reversal Zones
Resistance:
Support:
Recommendations:
Buying: Consider after confirmed signals from your trading systems.
Selling: Limited potential, safer to reduce volume size in trades.
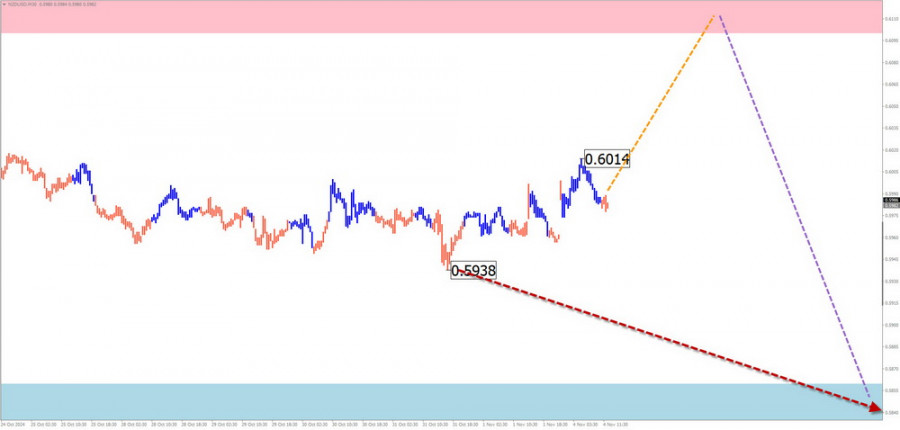
NZD/USD
Brief Analysis:
Since the end of last year, the chart for the New Zealand dollar has shown a bearish wave structure in the form of an extended horizontal flat. The current incomplete wave is finalizing the structure, with the price nearing the upper boundary of a broad potential reversal zone on the weekly scale.
Weekly Forecast:
The upcoming week is expected to continue with a general downward movement. In the initial days, a temporary rise is possible but not exceeding the resistance zone. The downward movement is likely to end in the calculated support zone.
Potential Reversal Zones
Resistance:
Support:
Recommendations
Selling: Can be considered with fractional volume sizes during individual sessions.
Buying: Premature until the current decline is complete.
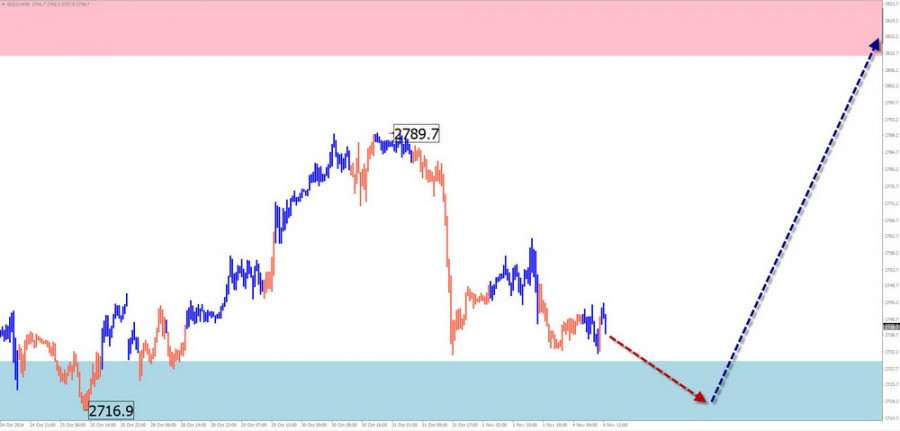
GOLD
Analysis:
The current wave structure, as of today, shows an upward trend starting from August 5. In the last three weeks, an intermediate correction (B) has developed along a strong level, which, after being breached, became support. The wave appears as an extended horizontal flat.
Forecast:
The downward movement in gold is expected to conclude in the next few days. In the support zone, a sideways movement and formation of reversal conditions could occur. The resumption of price growth is likely towards the end of the week. The calculated resistance marks the upper boundary of the expected weekly range.
Potential Reversal Zones
Resistance:
Support:
Recommendations:
Selling: High risk and trades may lead to losses.
Buying: Consider after reversal signals from your trading systems appear in the support area.
Explanations: In simplified wave analysis (SWA), all waves consist of 3 parts (A-B-C). The last incomplete wave is analyzed on each timeframe. Dashed lines indicate expected movements.
Note: The wave algorithm does not account for the duration of price movements in time.


