GBP/USD
Analysis:
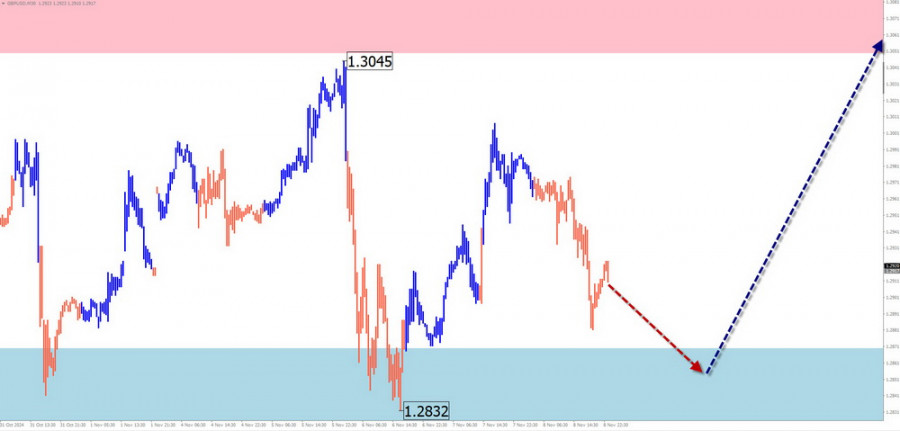
The short-term trend for GBP/USD has been bearish since mid-summer, with the final segment (Wave C) nearing completion. The pair is within a potential weekly reversal zone. The upward movement starting November 6 indicates potential for a reversal.
Forecast:The beginning of the week is expected to see sideways price movements near the support zone. A directional shift toward an upward trajectory is likely later in the week. Resistance is concentrated in multiple potential reversal areas.
Potential Reversal Zones:
- Resistance: 1.3050/1.3100
- Support: 1.2870/1.2820
Recommendations:
- Sell: Fractional volume sizes can be used in individual sessions based on signals near resistance.
- Buy: Wait for confirmed reversal signals in your trading systems before buying.
AUD/USD
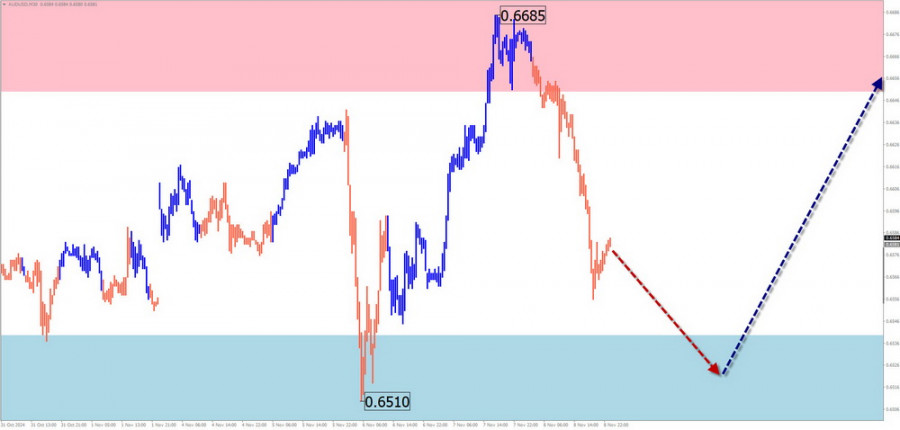
Analysis:The dominant bullish trend for AUD/USD has entered a corrective phase since early October. This correction remains within the boundaries of the previous major wave. The upward movement starting November 6 suggests the potential for a reversal and the initiation of a new trend segment.
Forecast:Sideways price movements are likely at the beginning of the week, with brief dips not expected to fall below the calculated support zone. Price volatility and growth are anticipated closer to the weekend. Resistance levels outline the upper boundary of the expected weekly range.
Potential Reversal Zones:
- Resistance: 0.6650/0.6700
- Support: 0.6540/0.6490
Recommendations:
- Sell: Risky due to limited downward potential.
- Buy: Consider buying upon confirmed signals near the support zone.
USD/CHF
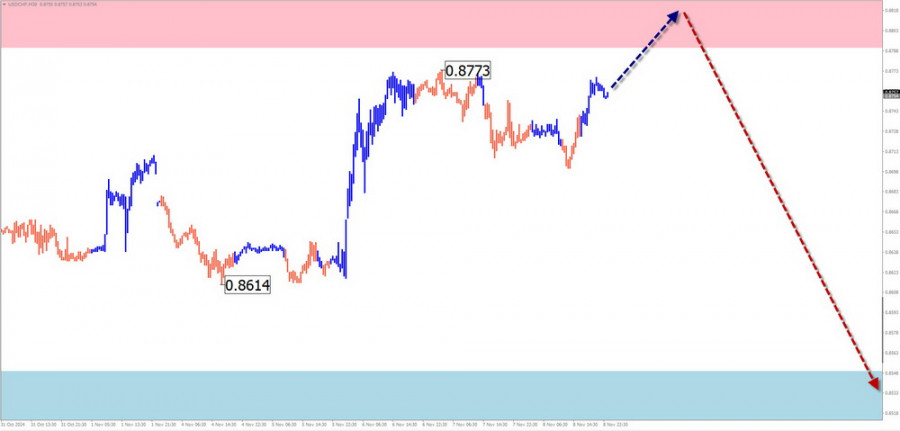
Analysis:Since early August, USD/CHF has been forming an upward wave, with the final segment (Wave C) nearing the target zone. The lower boundary of this zone aligns with calculated resistance.
Forecast:Early in the week, the pair is expected to rise toward calculated resistance. This may be followed by sideways movement and a temporary breach of the upper boundary. A reversal is likely later in the week.
Potential Reversal Zones:
- Resistance: 0.8850/0.8900
- Support: 0.8630/0.8580
Recommendations:
- Buy: Fractional volume sizes can be used for intraday trades.
- Sell: Consider selling only after confirmed reversal signals near resistance.
EUR/JPY
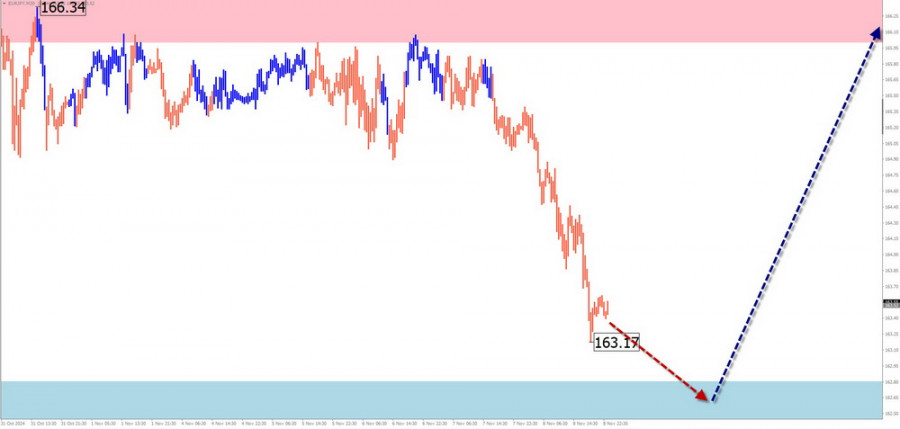
Analysis:The upward wave structure for EUR/JPY has been developing since August 5, with the final segment (Wave C) currently underway. In recent weeks, an intermediate pullback has formed within this structure.
Forecast:In the next few days, the pair is likely to continue its decline. A breakout below the calculated support zone is unlikely. By the end of the week, increased volatility is expected to lead to a reversal and renewed price growth.
Potential Reversal Zones:
- Resistance: 166.00/166.50
- Support: 162.80/162.30
Recommendations:
- Buy: Look for reversal signals near the support zone.
- Sell: Use fractional volume sizes for individual trading sessions.
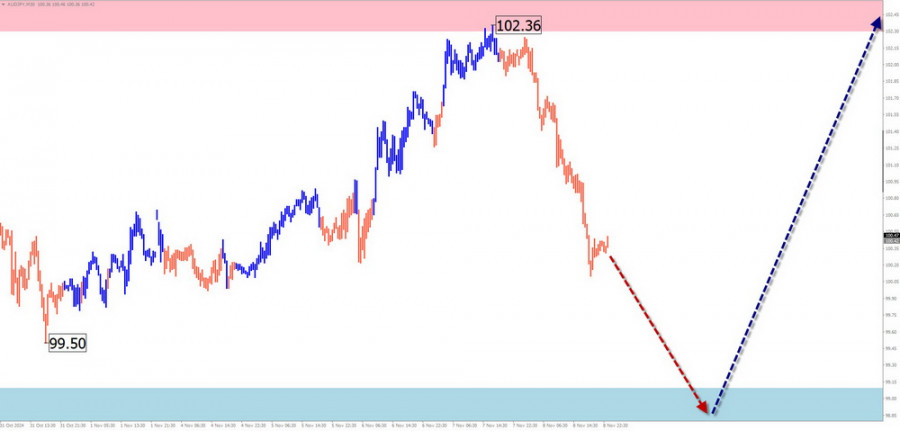
AUD/JPY
Analysis:The AUD/JPY pair has shown an upward price trajectory over recent months. The incomplete wave structure, starting August 5, is nearing the end of an intermediate correction within its final segment (Wave C). The pair is approaching a strong resistance level on the daily timeframe.
Forecast:A decline toward the support zone is likely early in the week, with possible pressure on its lower boundary. A reversal and subsequent price growth toward resistance are expected thereafter.
Potential Reversal Zones:
- Resistance: 102.30/102.80
- Support: 99.10/98.60
Recommendations:
- Buy: Wait for confirmed reversal signals near the support zone.
- Sell: Limited potential; trades may result in losses.
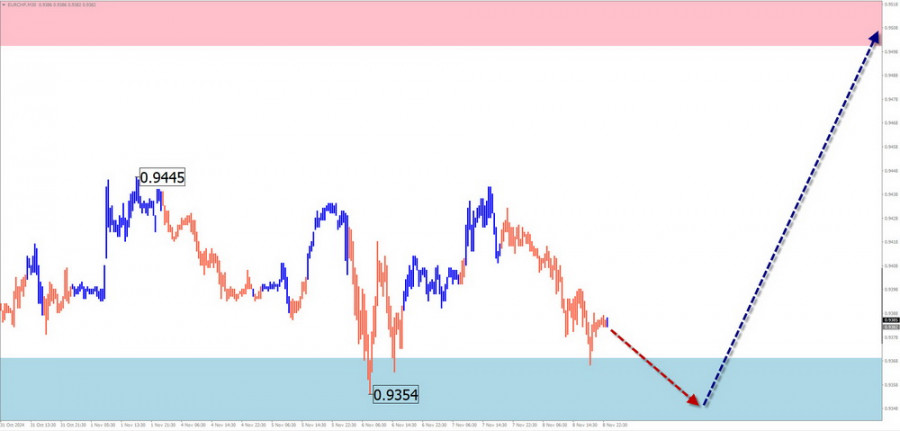
EUR/CHF
Analysis:The EUR/CHF pair has followed an upward wave structure since August 5. A correction (Wave B) has formed a horizontal flag pattern, which is now in its final phase.
Forecast:Downward pressure is expected early in the week, followed by a reversal and renewed price growth later in the week. Increased volatility and the release of key economic data may coincide with the directional change.
Potential Reversal Zones:
- Resistance: 0.9500/0.9550
- Support: 0.9370/0.9320
Recommendations:
- Buy: Consider buying after confirmed reversal signals near the support zone.
- Sell: Limited potential; trades may result in losses.
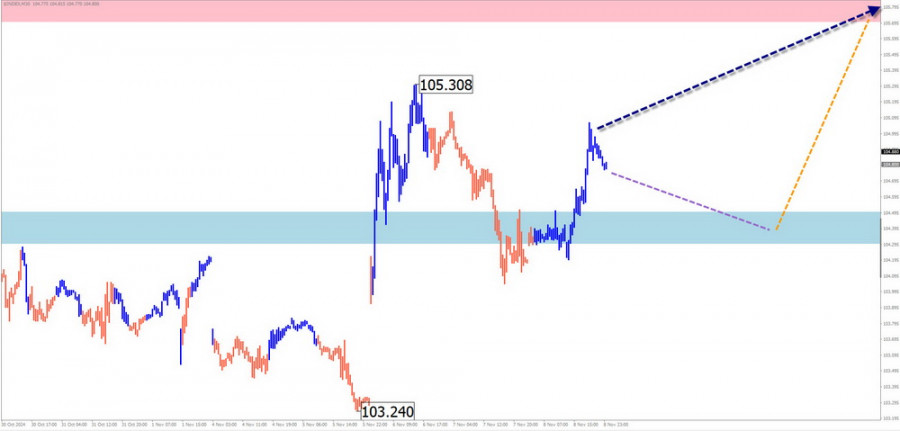
US Dollar Index
Analysis:Since late September, the USD Index has been recovering its previous losses. A counter-correction has been developing since early November, within a potential reversal zone.
Forecast:The index may approach calculated support early in the week, followed by sideways movement. A reversal to higher levels is expected thereafter. The upper boundary of the weekly range aligns with calculated resistance.
Potential Reversal Zones:
- Resistance: 105.70/105.90
- Support: 104.50/104.30
Recommendations:
- Sell: Selling major pairs with reduced volume sizes is recommended during individual sessions.
- Buy: Premature without clear reversal signals.
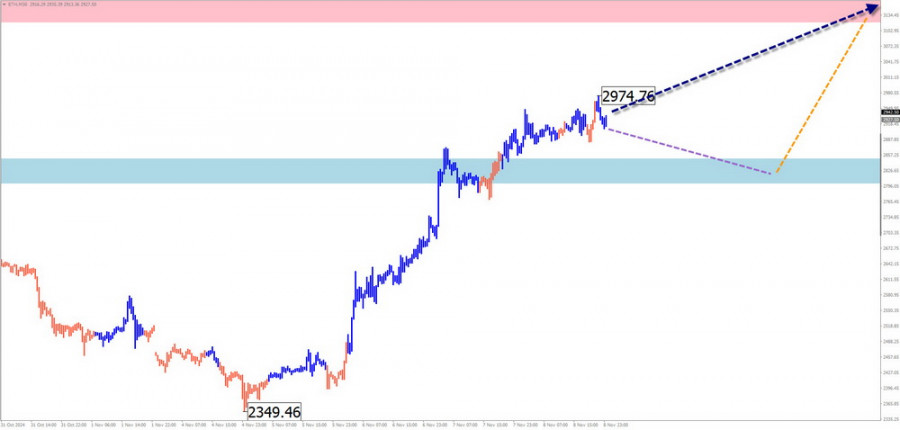
Ethereum
Analysis:Ethereum has been in an upward wave since August, with the final segment (Wave C) beginning November 5. After breaching intermediate resistance, the price may stabilize before resuming its upward trajectory.
Forecast:Flat or sideways price movements are expected in the first half of the week. Increased volatility mid-week may lead to a reversal and continuation of the uptrend. Resistance indicates the upper boundary of the wave's target zone.
Potential Reversal Zones:
- Resistance: 3120.0/3170.0
- Support: 2850.0/2800.0
Recommendations:
- Buy: Suitable after confirmed reversal signals near support.
- Sell: Low potential; use fractional volume sizes during individual sessions.
Explanations:
Simplified Wave Analysis (SWA) interprets waves as comprising three parts (A-B-C). The analysis focuses on the most recent incomplete wave on each timeframe. Dotted lines indicate expected movements.
Disclaimer:
Wave algorithms do not account for the duration of movements over time.


